Blog · How to Use · 2025-09-28
How to use QuantumGrid?
Every indicator based on a moving average or RSI gives a bullish signal after prices have risen significantly from the bottom, and a bearish signal after prices have fallen significantly from the top. Especially in lower timeframes, trend indicators such as Supertrend, Chandelier Exit, MACD, and Wavetrend give signals at the end of a price movement in small price movements, and the price often reverses immediately after the signal. QuantumGrid levels are good points for planning trades without waiting for prices to rise or fall, and success is possible with proper risk management.
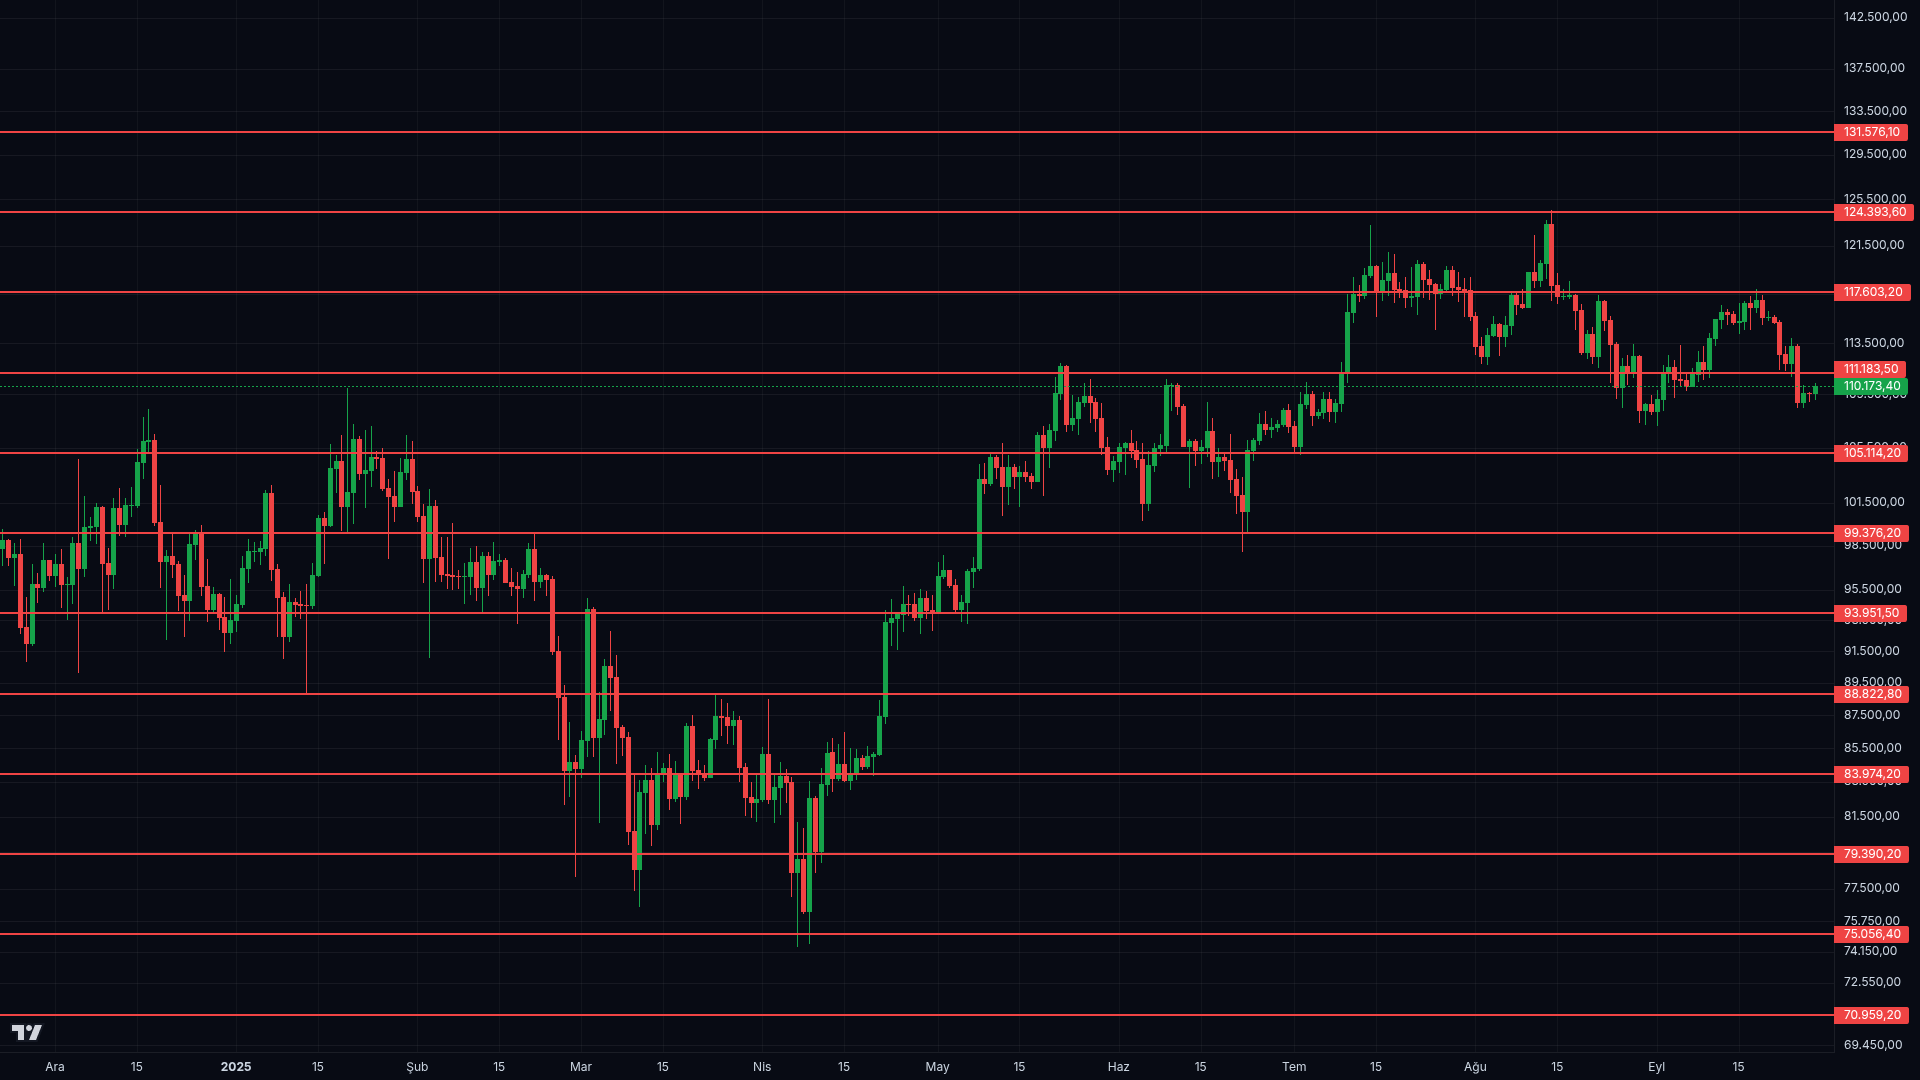
When you add the QuantumGrid indicator to your chart, you should consider the following: What is the trend? If you're in a strong bullish market, depending on the volatility of your chosen symbol, you can place LIMIT orders at short-term levels for slower symbols like BTC and ETH, and at long-term levels for volatile altcoins. You don't need to follow the chart. To buy on bullish signals, wait for prices to form a peak and then pull back slightly. Examine past price movements; this will help you understand the bullish and bearish movements of that symbol. Sometimes, you'll see a symbol break three long-term, or 30%, levels in a single move. In this case, you can look for SHORT opportunities at the third level on the next move. Instead of placing your orders on the lines just above or below the price, we recommend placing them on the second or third lines. These areas will coincide with areas where the RSI and many other leading indicators are signaling overbought or oversold.
No indicator offers a 100% guarantee of success in dynamic market conditions. QuantumGrid levels can break quickly, especially during price movements driven by news or manipulation. Therefore, don't carry your positions. Set a reasonable stop-loss and take-profit level for each trading plan. You can minimize your quickly profitable trades by placing a stop-loss order at the breakeven price, bringing your position to zero.
Before:
